
SQL Server Activity Monitor Tool for Database Administrators
SQL Server Activity Monitor is a new SQL Server tool for database administrators to control and troubleshoot SQL Server performance issues. SQL Server Activity Monitor tool combines a list of SQL Server performance data and serves collected performance data from various points with a graphical display to database administrators as a new SQL Server monitoring tool.
It is common for SQL Server DBA 's to execute custom T-SQL scripts to fetch and list performance data like executing processes when a bottle-neck exists on the database server. These performance measuring scripts change from administrator to administrator and most of them can not be managed from a single point monitoring tool. SQL Server 2008 Activity Monitor aims to provide a performance monitoring tool within SQL Server Management Studio.
SQL Server Activity Monitor is not only a performance reporting tool. Database admins can take actions on the Activity Monitor tool like to kill sql process which is causing a deadlock, etc. Also administrators can display T-SQL query details, check execution plans or launch SQL Server Profiles within the Activity Monitoring tool for SQL Server.
How to open Activity Monitor SQL Server Management tool in SQL Server 2008?
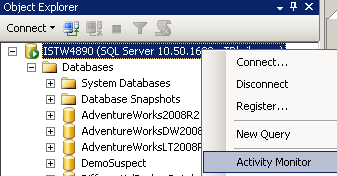
In order to start Activity Monitor, SQL Server administrators or developers should connect to target SQL Server instance using SQL Server Management Studio (SSMS). Then within the SSMS (SQL Server Management Studio) Object Explorer window right click on the target SQL Server instance and display context menu. Start Activity Monitor SQL Server tool by choosing the Activity Monitor option on the context menu.
But within the SQL Server 2008 Management Studio, the easiest method is using the Ctrl+Alt+A short-cut key for Activity Monitoring tool
An other method to start the Activity Monitor tool is using the standart menun icon for this tool in SQL Server Management Studio toolbar.
![]()
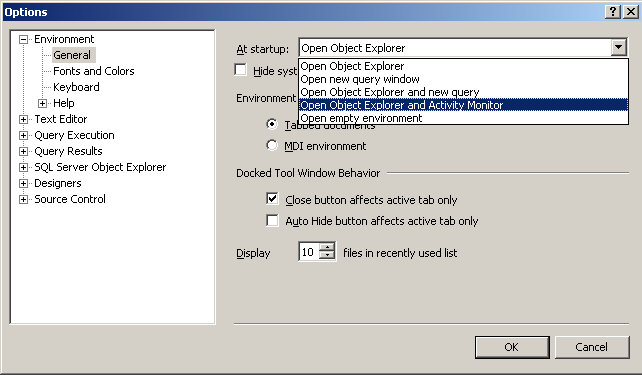
If as a database administrator, you want Activity Monitor to display automatically when SQL Server Management Studio (SSMS) is opened, you can play with the startup options of your SSMS client tool.
Goto Tools > Options
When the SQL Server Management Studio Options dialog screen is displayed drill down Environment > General options screen.
Choose the Open Object Explorer and Activity Monitor menu option from "At startup" dropdown list.
After setting this option active, when database administrators close and re-open Management Studio, Activity Monitor tool will be displayed automatically when the first SQL Server instance connection is done while SSMS start up.
Activity Monitor Dashboard
Activity Monitor SQL Server performance monitoring tool displays collected data grouped in 5 different panes.
There monitoring tool panes include:
Overview,
Processes,
Resource Waits,
Data File I/O, and
Recent Expensive Queries panes.
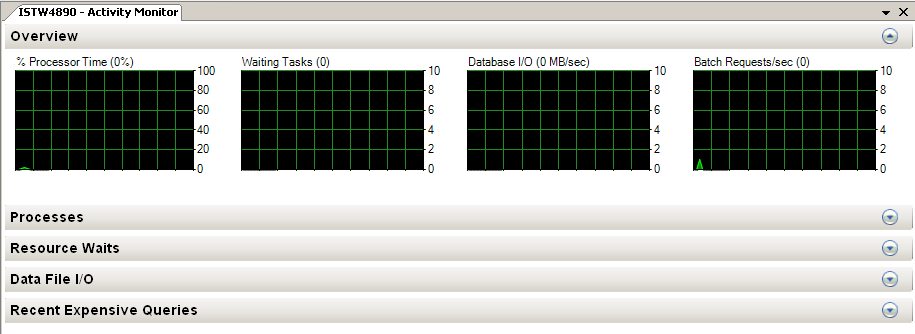
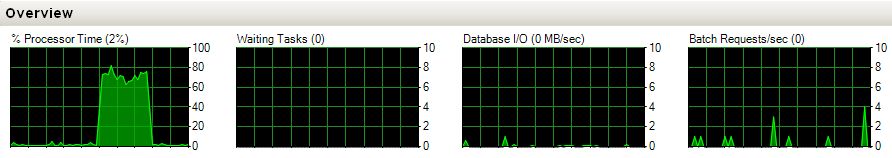
Activity Monitor Overview Pane
The overview pane displays % Processor Time, Waiting Tasks, Database I/O and Batch Requests in a graphical user interface just like Windows Task Manager. The data collected is refreshed with period defined as Refresh Interval. You can Pause and Resume data collection and displaying by right-clicking on the monitoring graph and choosing approptiate action from context menu.
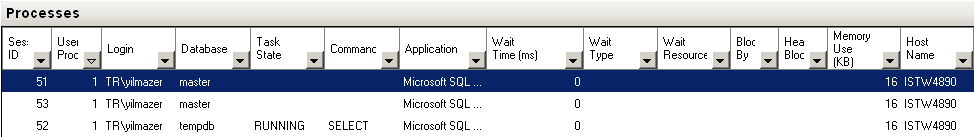
Activity Monitor Processes
The Processes tab in Activity Monitor tool in SQL Server displays active sql processes running on the SQL Server instance.
The SQL process displayed in this pane has the following detailed information about the process itself.
Session ID,
User Process,
Login,
Database,
Task State,
Command,
Application,
Wait Time (ms),
Wait Type,
Wait Resource,
Blocked By,
Heade Blocker,
Memoery Use (KB),
Host Name,
Workload Group
Database administrators can see the details about a process within the SQL Server Activity Monitor Processes pane.
Just right click on the target SQL process and from the context menu, choose "Details".
It is also possible to kill sql process from the same context menu by choosing "Kill Processes" option as follows.
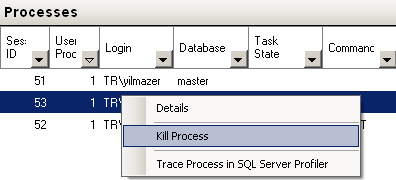
Further, SQL Server admins can launch SQL Server Profiler in order to trace the process from the same context menu.
One of the data that Activity Monitor tool for SQL Server serves for database admins is the information of blocked sessions and blocking sessions. Also in the activity monitoring Processes pane, the top blocking or the head blocking session is marked to catch the eyes of the database administrators at the first look.
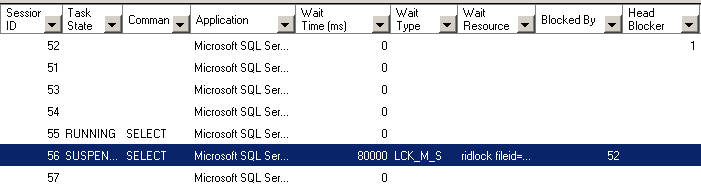
After database professionals found the pain-causing session that blocks other sessions and processes on the SQL Server, they can look at the query details and take action to kill process or not using the same Processes pane in SQL Server tool Activity Monitor.
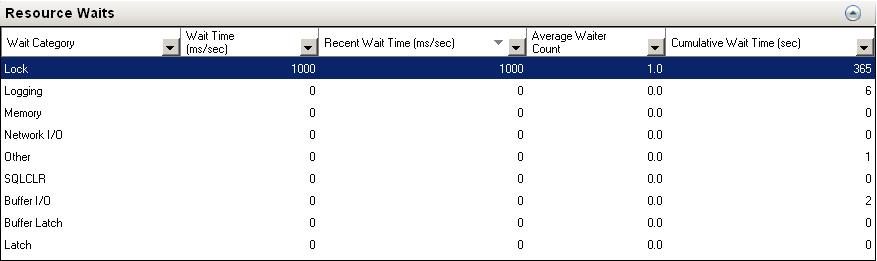
Activity Monitor Resource Waits
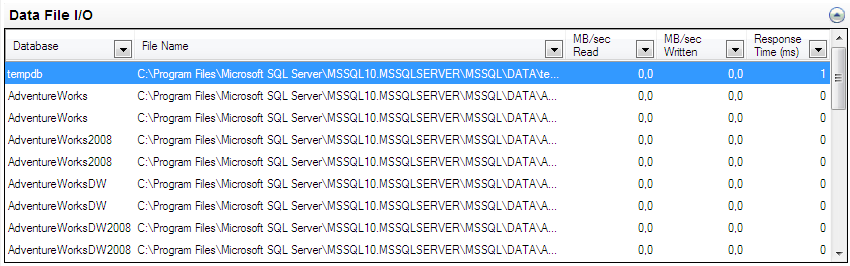
Activity Monitor Data File I/O
Data File I/O pane lists database files (data and log files) and read, write and response statistics for that database file
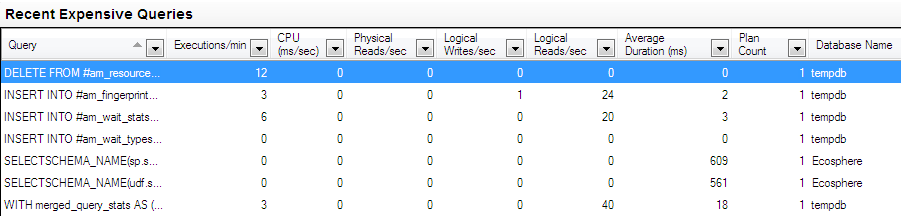
Activity Monitor Recent Expensive Queries
Recent Expensive Queries section of the SQL Activity Monitor tool displays a list of most expensive queries consuming most resources for the last 30 seconds. This list is an output of the SQL Server system views sys.dm_exec_requests and sys.dm_exec_query_stats. Database administrators can see the SQL queries that consume too much resources by using this dashboard view easily.
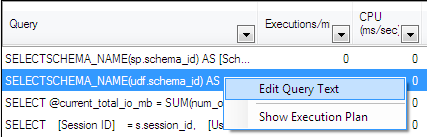
DBA's can view and edit the query text in the SQL Query Editor window by selecting the Edit Query Text menu option. Also administrators can launch the Actual Execution Plan of any query listed in the Recent Expensive Queries table of Activity Monitor tool.
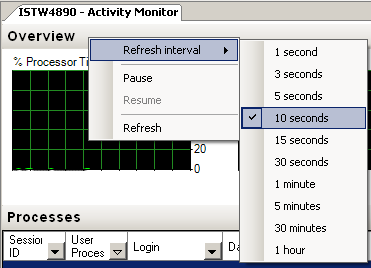
How to Set Refresh Interval
SQL Server Database administrators can customize the refresh interval for Activity Monitor tool. Refresh interval sets the sampling period for data displayed on the sql monitoring tool dashboard.
To change the default refresh interval setting 10 seconds, right-click on the Overview section of the Activity Monitor screen and choose Refresh Interval option as follows
The most important issue with refresh interval setting is for high load productive systems, a low refresh interval will cause execution of data collecting queries and task to perform frequently. And frequent execution of these queries and processes might effect the overall performance of the SQL Server in a negative manner. As a best practice, lower values than 10 seconds is not preferred on high workload production systems.
But the perfect refresh interval value for each SQL Server instance can be found by trying different period values and observing the effect of Activity Monitor process on the SQL Server performance.