Analyze Power BI Query Performance using SQL Server Profiler
Especially for self-service BI or Power BI is one of the most common reporting tools used by data professionals. This Power BI tutorial shows how report developers can use Power BI tools for performance analysis of their reports especially for SQL query performance on data source.
Launch Power BI Desktop software on your computer
After Power BI started, we will connect and trace Power BI tasks using SQL Server SQL Profiler tool. To do that we need the port number the Power BI is using for connections. Since this port changes we have to first launch the Power BI tool then figure out its ports in use.
We can detect the port numbers that the Power BI self-service reporting tool is using by means of Windows Powershell. So now we are ready to launch Windows Powershell as administrator.
![]()
When Windows Powershell started, execute the following command on Powershell command prompt
netstat -b -n
Then among output data on screen, search for "msmdsrv.exe"
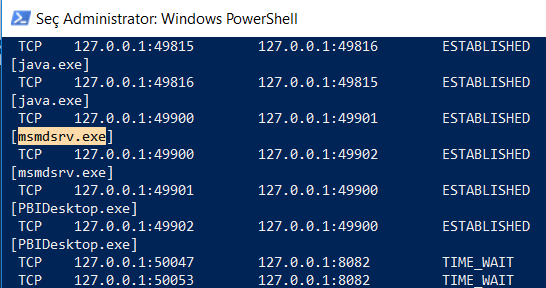
Take note of the port number "49900" in this case.
Please pay attention to the fact that each time a new Power BI Desktop application is launched, this port changes
To trace the SQL tasks being processed on Power BI we can now launch SQL Server Profiler
You can open SQL Server Profiler either using its application icon or within SQL Server Management Studio.
Now start a new trace via the icon on the menu bar, or follow menu options "File > New Trace"
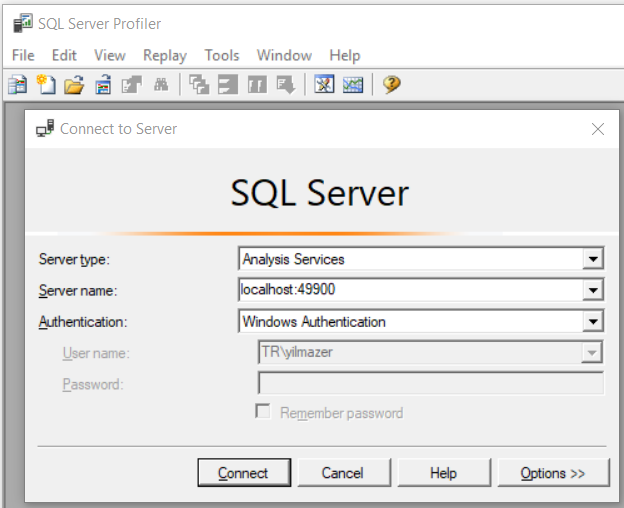
As seen as follows select "Analysis Services" in Server Type combobox.
In Server Name please enter localhost and the port number we have fetched using PowerShell in previous steps in the format of "localhost:49900"
And connect to the server via SQL Profiler tool.
And simply press "Run" on "Trace Properties" screen to start tracing Power BI using SQL Server SQL Profiler
Now let's switch to Power BI Desktop screen.
I will show an other alternative tool to trace performance metrics which is new for Power BI report developers shipped with Power BI tool.
Developers can also activate Performance Analyzer feature which is introduced recently for Power BI developers to analyze performance issues with their reports.
Just mark the checkbox next to "Performance Analyzer" within View menu.

Click on Start Recording on Performance Analyzer tool as seen in below screenshot.
You can switch to a new empty page.
You can now see that every action you take on Power BI will be listed in Performance Analyzer so you can compare for example two different reports or data visualizations easily.

On Home menu click Get Data
This menu will help us to define a new data source for your SQL report or use one of the previously created ones.
Choose the option according to where you will read your data for your Power BI report
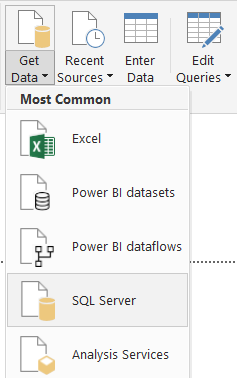
Connect to the report data source
As a second step, you will choose the database table or view that you want to display on your Power BI report.
Select the table/view and press Load button
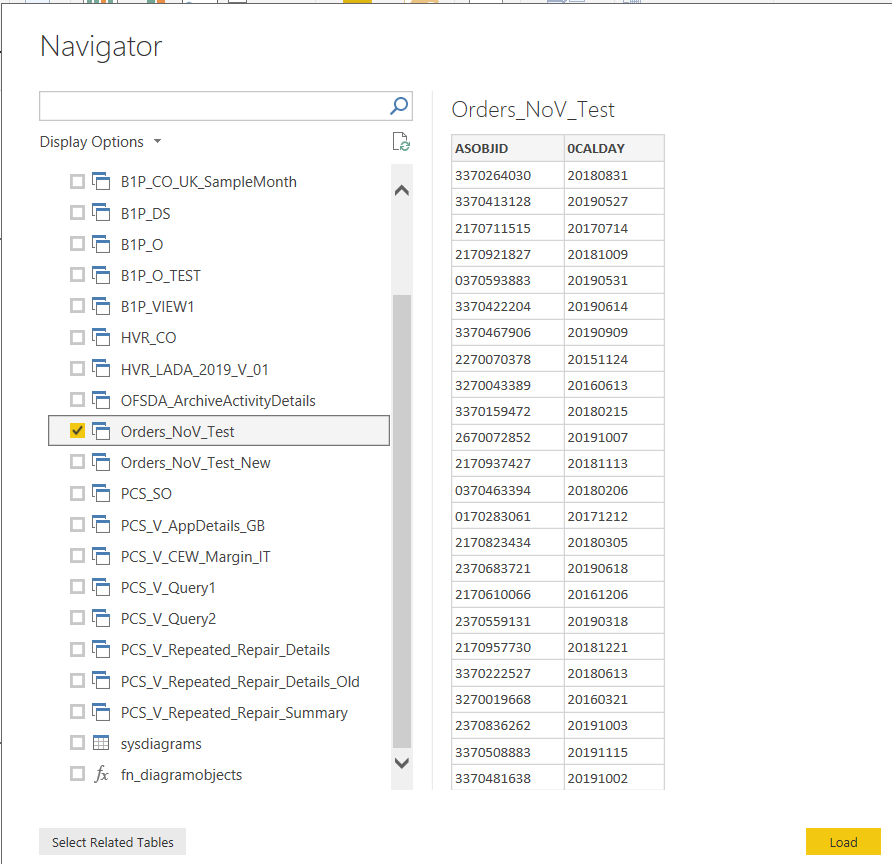
After your data source selection for your Power BI report, you will see that the active trace in SQL Profiler will start showing actions taking place to access data from source and internal tasks processed within Power BI Desktop
Pay attention to "17 - ReadData" events.
This maps to data reading for Power BI report task where the SQL query to fetch report data is executed.
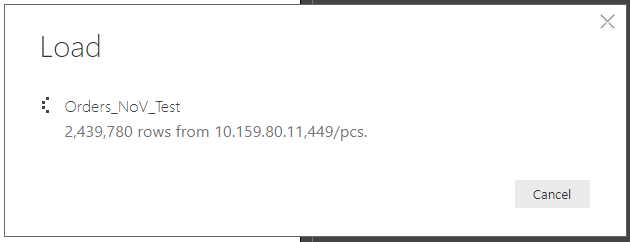
When data load is completed, in SQL Profiler trace logs, search for "Finished reading data for" or the last line for the ReadData event.

Go to the Duration column. You will see the duration required to read data from its source for the Power BI report.
Above and below screenshots are from two different data sources showing one data source is performing much better than the other one.

I hope this tutorial is useful for Power BI developers understand how SQL Server Profiler and Performance Analyzer tools can be used for measuring and analyzing their report's performance to fetch the data from its source.
