Create your first SQL Server Reporting Services Report
In this SQL Server Reporting Services tutorial, business intelligence developers will create their first report using SQL Server Data Tools 2015 for SQL Server 2016 Reporting Services.
Business Intelligent developers on SQL Server Data Platform can create solutions as Analysis Services, Integration Services or Reporting Services projects created by using an IDE named SQL Server Data Tools. This SSDT aka SQL Server Data Tools is a seperate download and requires an additional installation which adds BI templates in Visual Studio IDE. For SQL Server 2016 the best solution is provided by Microsoft Visual Studio 2015. The SSDT is known as SQL Server Data Tools 2015.
To create a SQL Server Reporting Services report on SQL Server 2016 environment follow the below steps.
First launch SSDT (SQL Server Data Tools)
Create project by following menu options: File > New > Project...

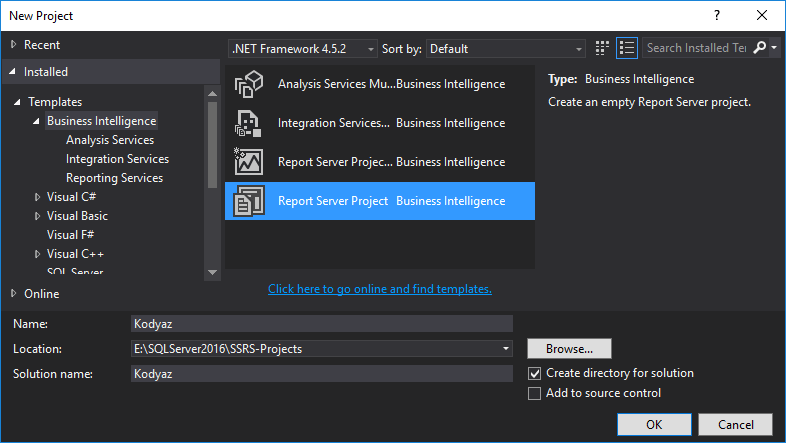
From installed templates, choose SSRS (SQL Server Reporting Services) template seen below as Report Server Project Business Intelligence template
Type the name of the Report Server project and select a location for project solution files including report files.
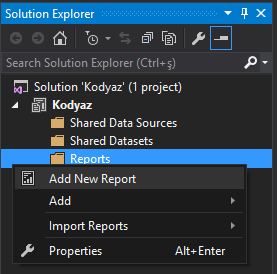
Add new report to solution by right click on Reports node in the Solution Explorer windows seen in the following screenshot.
This is a simple way to create reports for Reporting Services.
Report Wizard will guide us to complete the basic tasks for creating a new report on SQL Server Reporting Services using SSDT (SQL Server Data Platform)
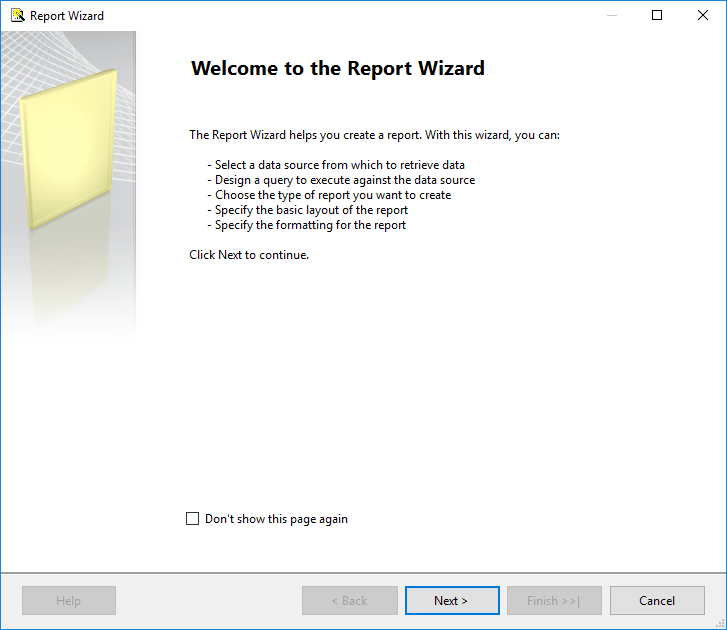
As seen on the first page of the Report Wizard, following steps will be completed in order to create a report in SQL Server 2016 Reporting Services project
Design a query to execute against the data source
Choose the type of the report you want to create
Specify the basic layout of the report
Specify the formatting for the report
Let's start the wizard to define datasource for the report.
This is simply identifying the database and connection properties where the data resides.
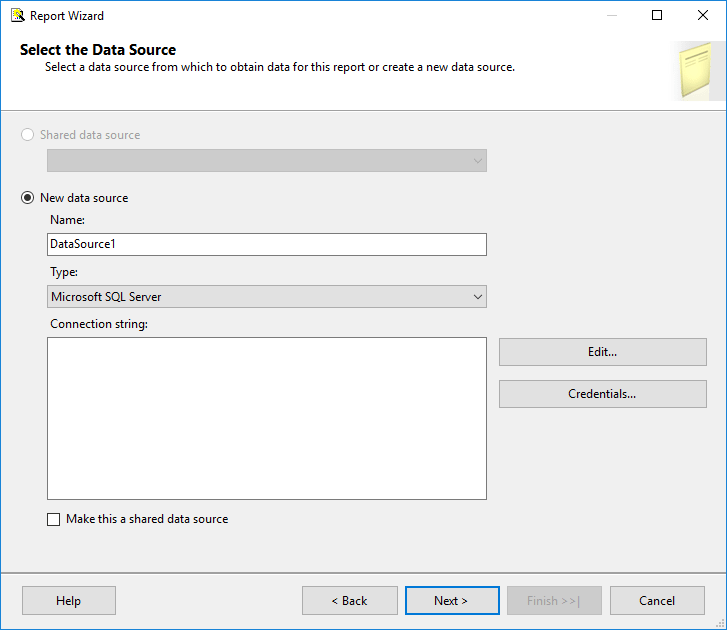
As seen above, since we have not yet created any shared data sources this option is deactivated on the screen.
Type a meaningful name for the report data source
Since I want to use SQL Server sample database WideWorldImporters I will name the data source as "World Wide Importers" instead of default name DataSource1
The datasource is my local default SQL Server instance. So in the Type dropdown Microsoft SQL Server will be left unchanged
Press Edit to configure the connection string for the report data source

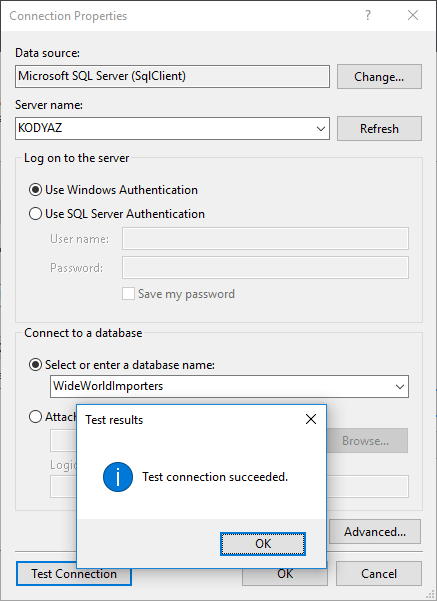
On Connection Properties screen, Business Intelligence developer can select the data source type, data source and authentication properties.
For this Reporting Services tutorial, I want to display data from SQL Server 2016 sample database WideWorldImporters.
So I leave unchanged the default "Microsoft SQL Server (SqlClient)" option on "Data Source" section.
In "Server name" part, provide the SQL Server instance name where you want to retrieve and display data from
I will use Windows Authentication, so did not change on "Log on to the server" section.
One last step for defining the data source is pointing to the database. So select the database name from the combobox.
Now we are ready to test our configuration. Just press "Test Connection" button to test the data source configuration for the report
Click OK to return
Mark "Make this a shared data source" so you can use this data source in your other reports in this Reporting Services project
![]()
Click Next
Use Query Builder and Query Designer to fetch data for your Reporting Services report.
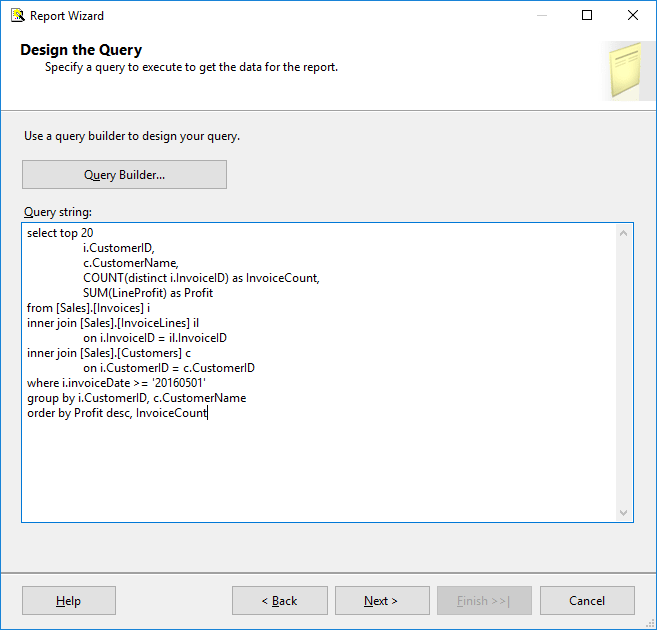
Or type the SQL SELECT script in the "Query String" section
select top 20

 i.CustomerID,

 c.CustomerName,

 COUNT(distinct i.InvoiceID) as InvoiceCount,

 SUM(LineProfit) as Profit

from [Sales].[Invoices] i

inner join [Sales].[InvoiceLines] il

 on i.InvoiceID = il.InvoiceID

inner join [Sales].[Customers] c

 on i.CustomerID = c.CustomerID

where i.invoiceDate >= '20160501'

group by i.CustomerID, c.CustomerName

order by Profit desc, InvoiceCount
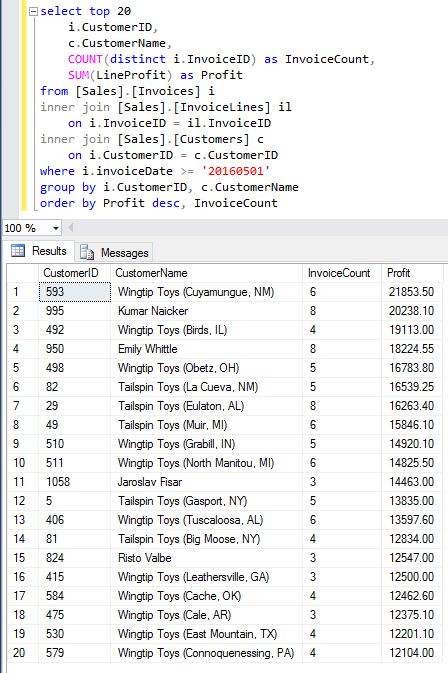
As programmers can see we expect to see below SQL query output in our sample Reporting Services report.
As you see below, I copied the SELECT statement in the Query String section.
I general instead of directly pasting SQL Select statements, BI developers generally call SQL Server stored procedures for fetching report data
Click Next button for next step in the create report wizard.
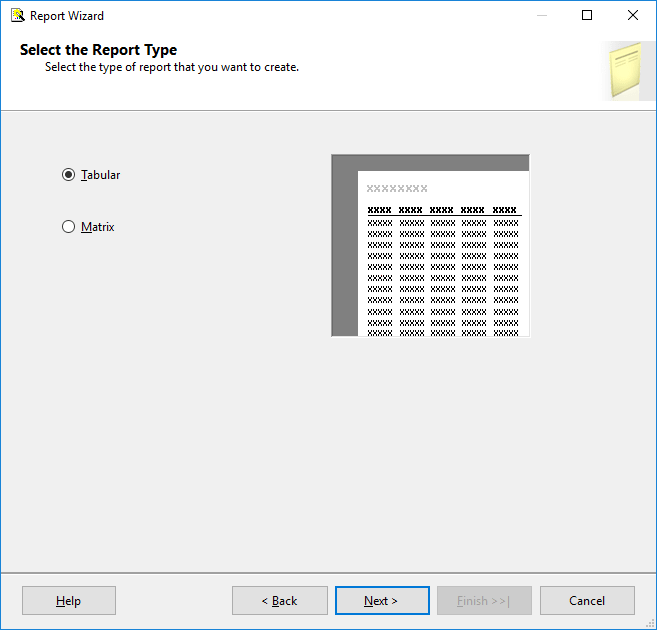
Choose Tabular or Matrix report layout. I choose Tabular for simplicity
Click Next
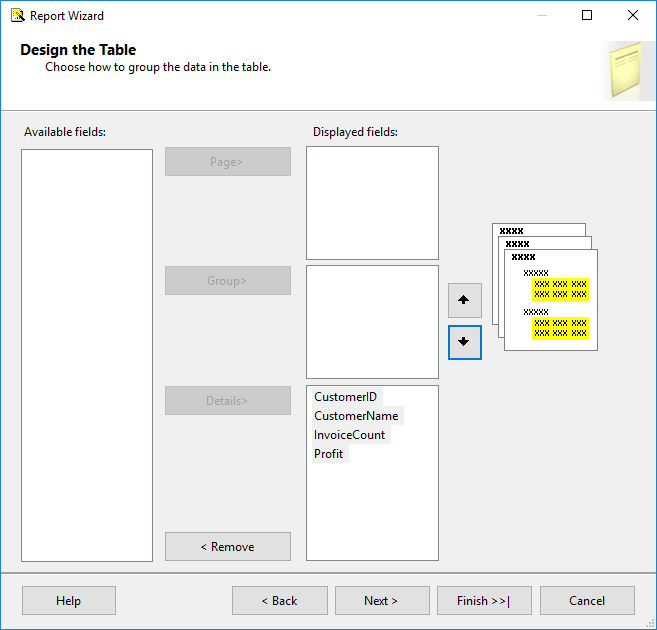
Design the data table.
This step in report creation wizard enables developers to group data quickly for a better display format
The last step enables the developer to name the report as well as checking configuration for the last time.
There is also a "Preview report" option
I named report as "Top20Customers" instead of default name Report1
Also a summary of the steps taken in the report create wizard is displayed on screen like data source, query string, grouping options, etc.
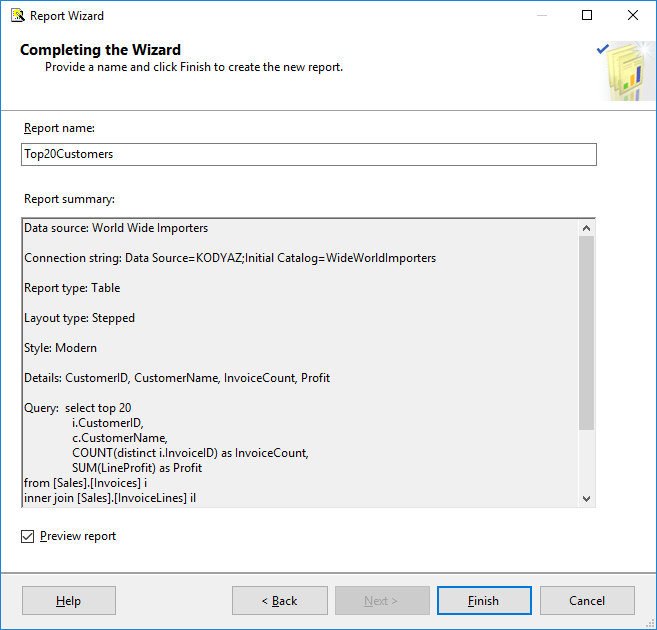
Press Finish
In following screenshot, business intelligence professionals can see the Reporting Services report created on SQL Server Data Tools 2015. As we have designed the data source connection properties, data is selected from SQL Server 2016 sample database.
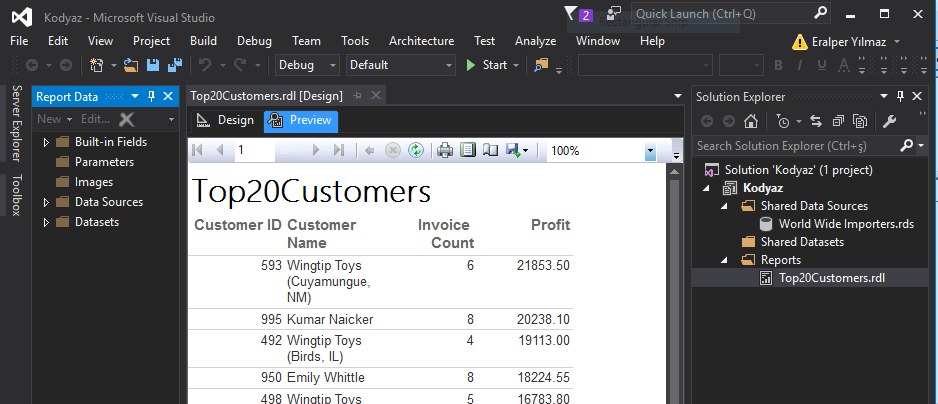
As seen, in the inner section of the SQL Server Data Tools the preview of the report takes place.
On the right section in Solution Explorer window, the BI Reporting Services project template files are seen.
Data source file has .rds file extension.
Reporting Services report definition files have .rdl file extension.
In our next Reporting Services tutorial, we will demonstrate how to deploy rdl report files to SQL Server 2016 Report Server.
I hope report developers who are new with SQL Server Reporting Services like this tutorial on report creation steps using SQL Server Data Tools.
