How to Debug Stored Procedure in SQL Server 2008
Create a simple SQL stored procedure in SQL Server 2008 database.
Just to make a short introduction for how to debug stored procedure in SQL Server 2008, I code the below t-sql code and execute it to create stored procedure in sample SQL Server database.
CREATE Procedure spDebugStoredProcedure

(

 @i int

)

AS


While @i < 10

begin

 If @i = 3

  print 'Three'

 Else

  print @i


 set @i = @i + 1

end
Then you can open a new Query Editor windows using Ctrl+N in SQL Server Management Studio.
Paste the following t-sql command which calls the sql stored procedure we have just created in SQL Server 2008 database.
EXEC spDebugStoredProcedure 1
If you press F5, or Execute button the SQL engine will execute the sql stored procedure code with given input parameter values and display the output.
But in order to debug stored procedure in SQL Server 2008, t-sql developers can use Debug menu within the SSMS screen.
Pressing F11 or F10 will activate the SQL Server Management Studio Debugging screens and processes.
In order to step into stored procedure t-sql codes, the sql developer can continue with F11 Step Into short-cut.
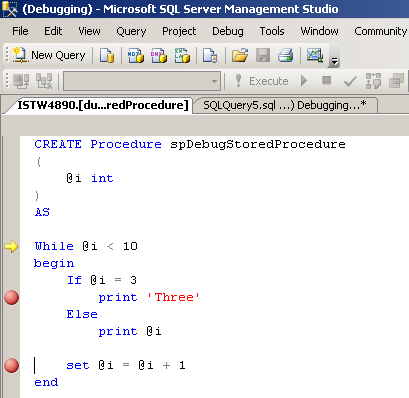
If you step into SQL stored procedure codes, a new query editor will be opened displaying the t-sql source scripts of the related stored procedure.
By clicking on the grey area on the left of the debugging screen, t-sql programmers can place breakpoint on the sql code lines they want.
Within the SQL Server 2008 SSMS, many debugging windows will be activated for more control and information to sql developers.
Locals, Watch 1, Call Stack, Breakpoints, Command Window, and Output sub-screens are those helper debugging screens while debugging stored procedure in SQL Server 2008.


